How Not to Benchmark a Rails App
It starts with “I’m just going to use benchmark/ips and openuri,
its just a couple lines of code”.
So you copy over config/environments/production.rb to
config/environments/benchmark.rb to have the same settings, disable
SSL, add a prefix to assets
path
to avoid interfering w/ development, add a DB configuration for the new
env, run RAILS_ENV=benchmark rails db:setup and RAILS_ENV=benchmark rails assets:precompile.
Whip up a trivial rake task:
require 'benchmark/ips'

namespace :traffic do
  desc "Benchmark the app"
  task :benchmark do
      Benchmark.ips do |x|
        x.report("slow app is slow") do
          URI.open("http://localhost:3000/")
        end
      end
  end
end
Start the server:
SECRET_KEY_BASE_DUMMY=1 RAILS_ENV=benchmark rails s
and off you go:
demo@app:~/demo$ RAILS_ENV=benchmark rake traffic:benchmark
ruby 3.3.0 (2023-12-25 revision 5124f9ac75) [x86_64-linux]
Warming up --------------------------------------
    slow app is slow     1.000 i/100ms
Calculating -------------------------------------
    slow app is slow     18.749 (±16.0%) i/s -     91.000 in   5.041423s
Hmm, how to compare this to a baseline? So you add support for
benchmarking another endpoint, specifying alternative port, etc.
Starting the alternative server could be automated, and benchmark-ips
supports resuming a run from a different process, but meh, let’s keep it
manual for now:
demo@app:~/demo$ COMPARE=1 RAILS_ENV=benchmark rake traffic:benchmark
ruby 3.3.0 (2023-12-25 revision 5124f9ac75) [x86_64-linux]
Warming up --------------------------------------
    slow app is slow     1.000 i/100ms
 alternative is fast     1.000 i/100ms
Calculating -------------------------------------
    slow app is slow     19.279 (±15.6%) i/s -     94.000 in   5.009547s
 alternative is fast     20.352 (± 9.8%) i/s -    101.000 in   5.021022s

Comparison:
 alternative is fast:       20.4 i/s
    slow app is slow:       19.3 i/s - same-ish: difference falls within error
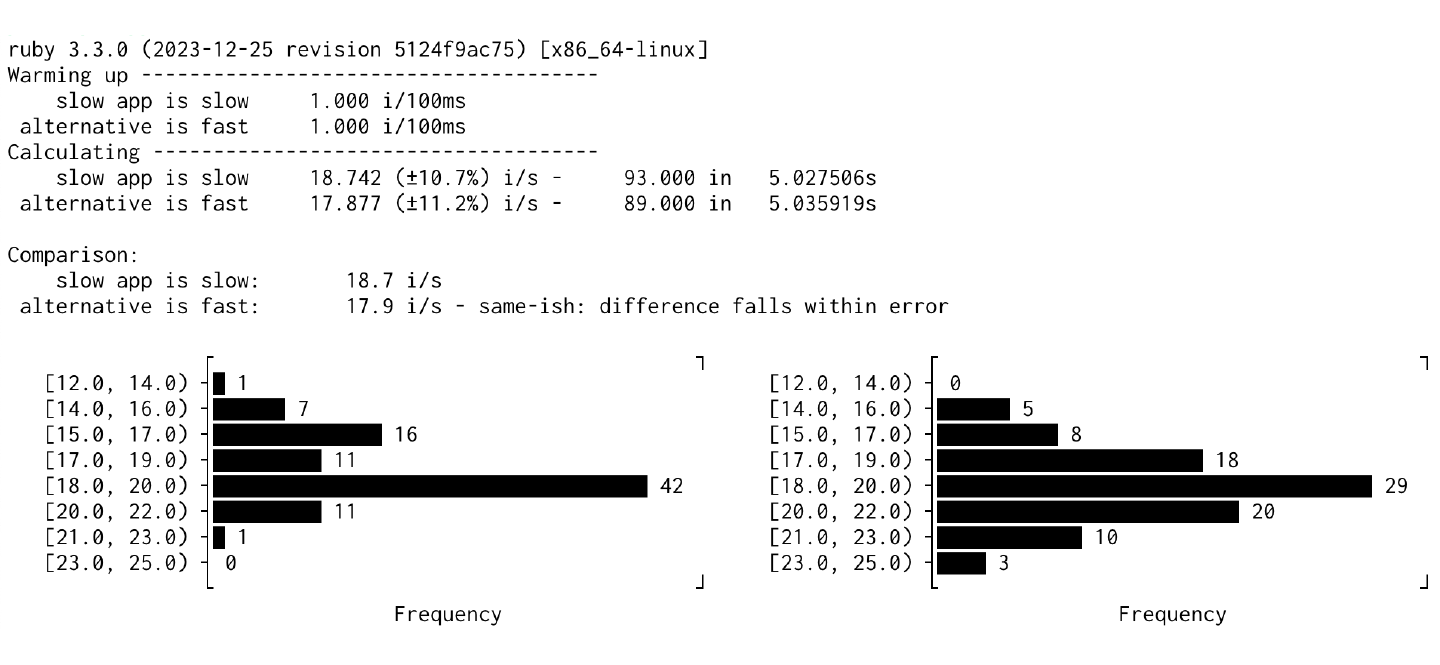
Except that now you have two measurements, and these are just averages, but how does the latency distribution look like?
So you add mini_histogram,
fiddle a bit around passing benchmark/ips report to it, and get a
beautiful, ASCII, side by side comparison:

And now you wonder, where does the app get slow, so you add stackprof as a middleware to the app…
# config/application.rb

if ENV.fetch("STACKPROF_ENABLED", "0") == "1"
  config.middleware.use StackProf::Middleware, enabled: true, mode: :cpu, interval: 1000, save_every: 5
end
demo@app:~/demo$ stackprof tmp/stackprof-* --text --limit 5
==================================
  Mode: cpu(1000)
  Samples: 286 (0.00% miss rate)
  GC: 6 (2.10%)
==================================
     TOTAL    (pct)     SAMPLES    (pct)     FRAME
        35  (12.2%)          35  (12.2%)     PG::Connection#exec_prepared
        40  (14.0%)           7   (2.4%)     Class#new
         6   (2.1%)           6   (2.1%)     (sweeping)
         9   (3.1%)           6   (2.1%)     Hash#fetch
         9   (3.1%)           4   (1.4%)     ActionView::Helpers::TagHelper::TagBuilder#content_tag_string
And at that point, you think you should’ve went with derailed_benchmarks from the start, because it does all of this, and a lot more. After all, it was just a couple lines of code, right?