Tracking down a memory leak
Tl;Dr: I followed this guide
to debug a memory leak in a Sidekiq job. In my case, the leak was
caused by a thread local array buffer in lograge-sql that never got
cleared.
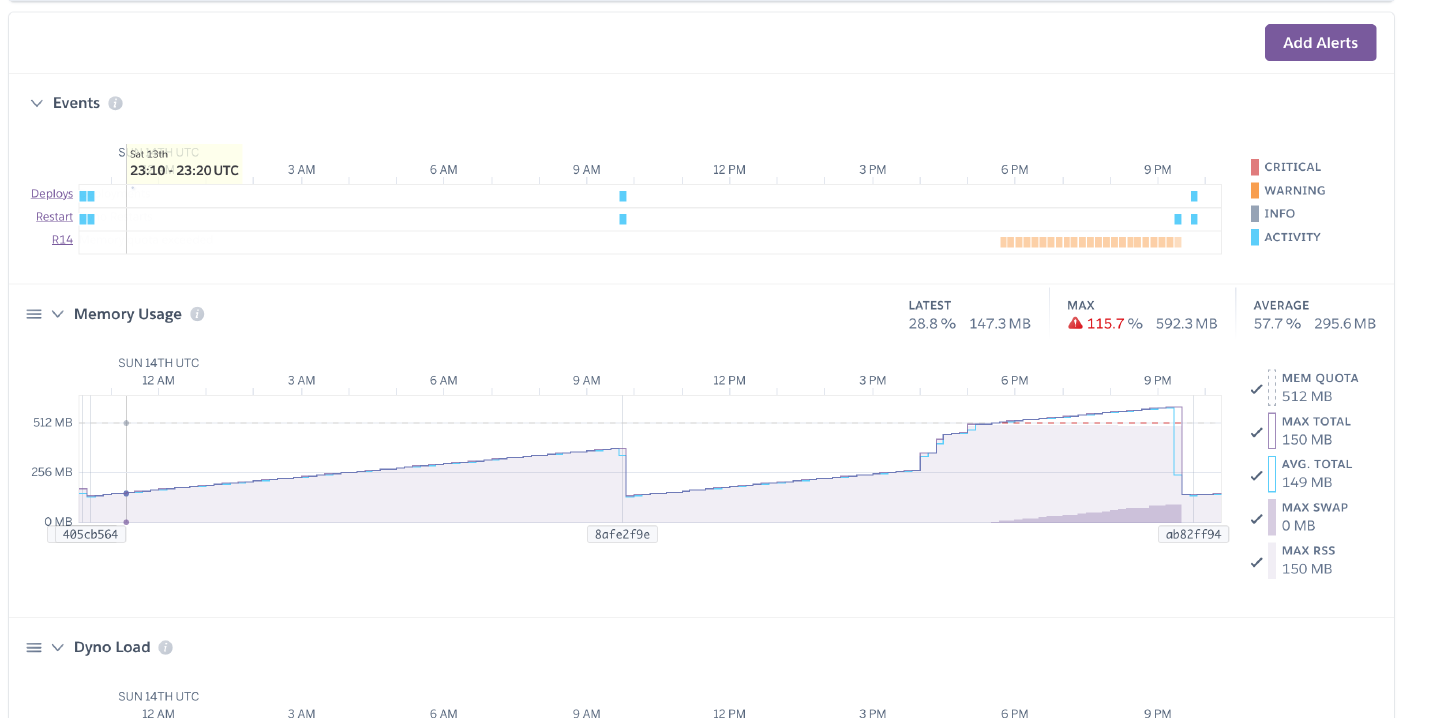
With PlainAPM infra moved away from Heroku, one of the first monitors I implemented were for the app’s memory, as previously Heroku metrics showed a persistent growth for the Sidekiq process:

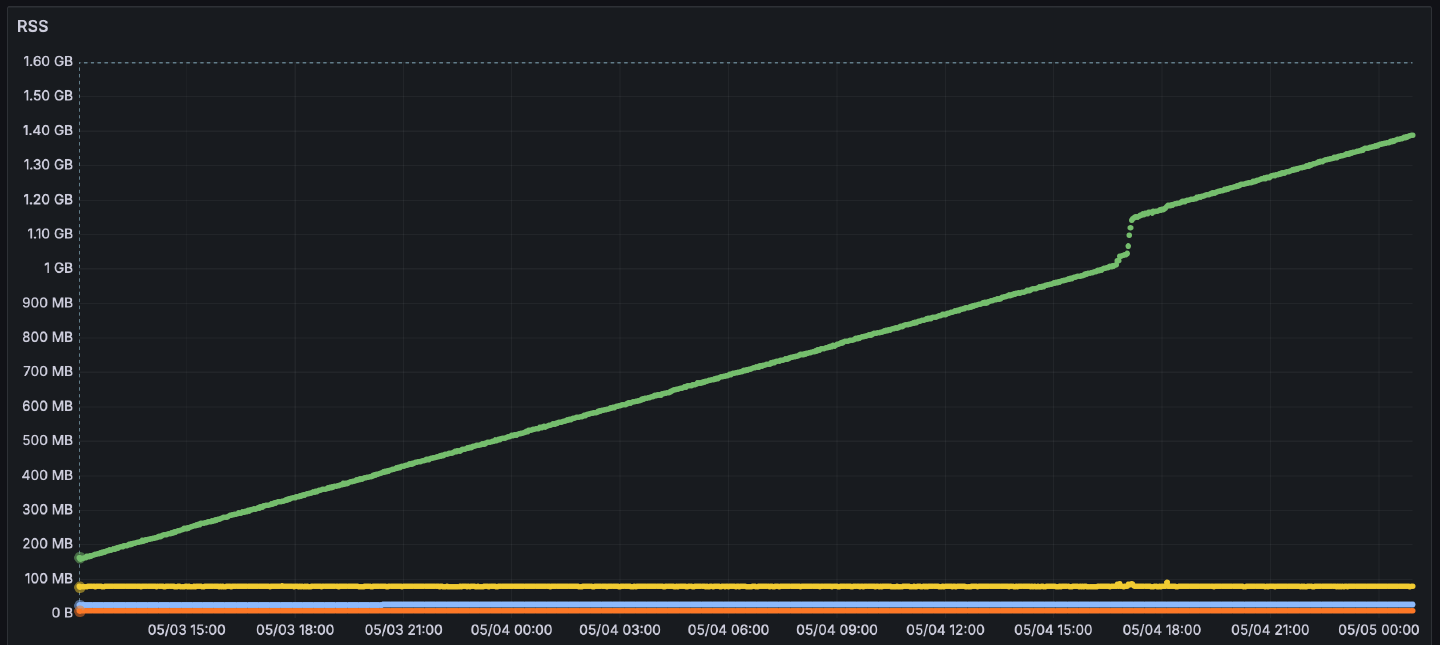
Initially, I thought it was a memory fragmentation issue, and that the process is allocating objects in a way that doesn’t allow releasing the memory back to the OS. I tried switching to jemalloc, which is supposedly better at handling fragmentation than the standard malloc, and also has a built-in support for leak checking.
But it didn’t help:

Luckily, I stumbled upon the above mentioned guide and from there, things were relatively straight-forward.
I had it a bit simpler than Jacopo in the original post, as I was
able to reproduce the issue locally, and so did not need to be careful
around production. I installed rbtrace so I could capture heap dumps
from a running process, enabled trace_object_allocations:
# in bin/sidekiq binstub generated by Bundler

if ENV["TRACE_OBJECT_ALLOCATIONS"]
  require "objspace"
  ObjectSpace.trace_object_allocations_start
end
triggered the Sidekiq workload in between the three captures, and used heapy diff on the heap dumps to get the retained objects:
$ heapy diff /tmp/0.json /tmp/1.json /tmp/2.json  | head -10
Retained STRING 14994 objects of size 9596160/9611080 (in bytes) at: /home/plainapm/.gem/ruby/3.3.1/gems/lograge-sql-2.3.2/lib/lograge/sql.rb:53
8< --- snipped for brevity ---
This probably should have been enough to point me to the right direction, but I continued to follow the blog post, and obtained the address info
$ grep "file.*lib/lograge/sql.rb.*line.*53" /tmp/2.json | head |  grep -o "address\":\"[^\"]\+\""
address":"0x7fa51f9c0c90"
address":"0x7fa51f9c5510"
address":"0x7fa51f9c6910"
%< --- snipped for brevity ---
and the path between the objects with sheap:
$ sheap /tmp/0.json /tmp/2.json
$before: #<Sheap::Heap (269834 objects)>, $after: #<Sheap::Heap (289990 objects)>, $diff: #<Sheap::Diff (20338 objects)>
irb#1():001> $diff.after.find_path($diff.after.at("0x7fa51f9c0c90"))
=>
[#<ROOT vm  (2757 refs)>,
 #<DATA 0x7fa5218baa10 ractor (15 refs)>,
 #<DATA 0x7fa51fbadf58 VM/thread (10 refs)>,
 #<DATA 0x7fa51f92f600 fiber (220 refs)>,
 #<HASH 0x7fa51f8ec6c0  (1 refs)>,
 #<ARRAY 0x7fa51f950288  (4990 refs)>,
 #<STRING 0x7fa51f9c0c90 "<some string>">]
This, and looking into the code finally made me realise what’s up:
I’m a big fan of canonical log
lines, so in this case, I was
using lograge to get a single line per request that can be easily parsed
later on.
To be able to log Rails’ SQL queries this way, I also added a lograge-sql gem.
Under the hood, this library uses an ActiveRecord event subscriber to capture SQL queries into a thread local buffer.
In the usual case, e.g. while processing a request, the buffer would get
passed over to lograge through a hook into the extract_request
method. This would emit the log line, but also clear the
store.
However, grepping and rummaging through the lograge code revealed that
it only
activates
for ActionController and optionally, ActionCable.
For ActiveJob, or a class including Sidekiq::Job, extract_request
would never get called, and the buffer would grow indefinitely with every executed
SQL query.
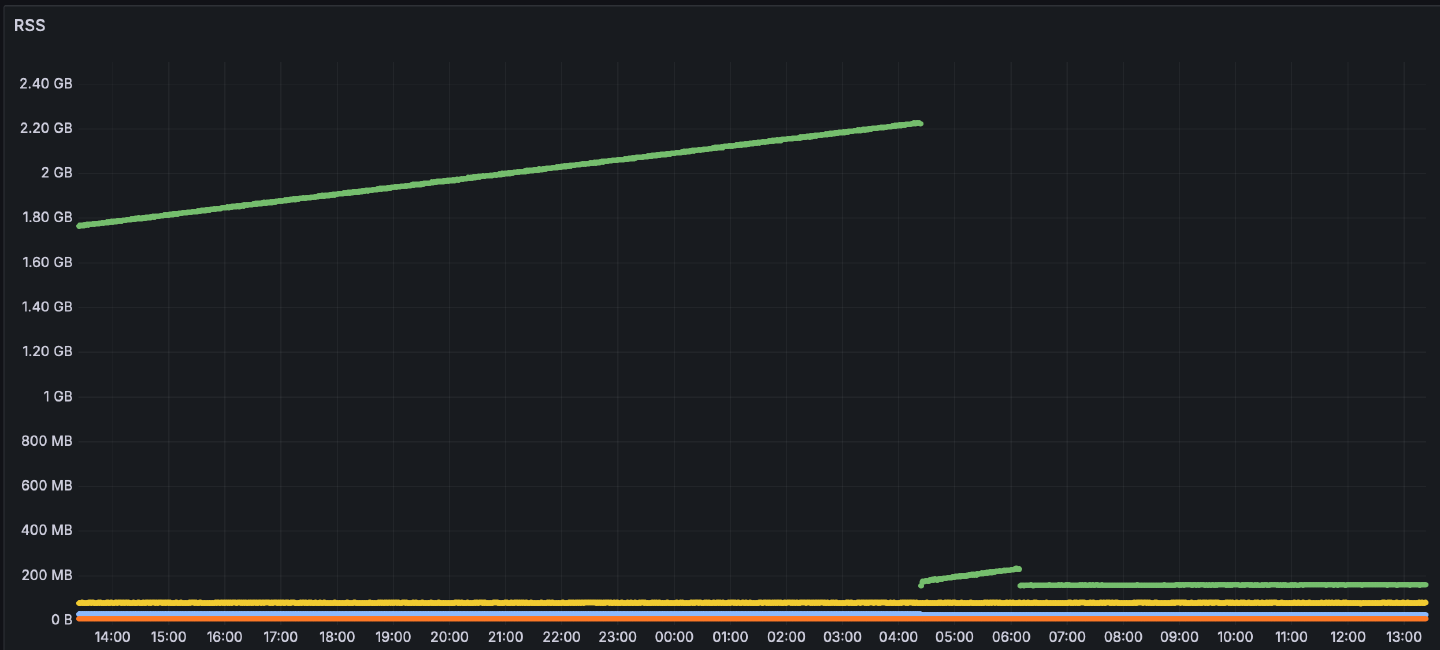
For now, I fixed the leak by disabling lograge whenever Sidekiq.server? is
not nil. Now, this looks much better:
